
- Ethereum price started a strong rebound from the $170 swing low against the US Dollar.
- ETH price is currently trading near the $200 level and is consolidating recent gains.
- There was a break above a crucial bearish trend line with resistance near $194 on the 4-hours chart (data feed from Coinbase).
- The price might consolidate in the short term before it starts another upward move above $205.
Ethereum price is showing a few positive signs above $194-$195 against the US Dollar. ETH price is likely to continue higher once it settles above $202 and $205.
Ethereum Price Analysis
This past week, Ethereum price extended its decline below the $190 support against the US Dollar. The ETH/USD pair even broke the $180 support and settled well below the 55 simple moving average (4-hours). Finally, the price traded to a new monthly low near $170 and recently started an upside correction. The price was able to climb back above the $180 and $184 resistance levels.
Additionally, there was a break above the 23.6% Fib retracement level of the last crucial drop from the $239 high to $170 low. More importantly, there was a break above a crucial bearish trend line with resistance near $194 on the 4-hours chart. The price climbed back above the $195 level and the 55 simple moving average (4-hours). The price is now trading near the $202 resistance level, which is protecting further upsides.
Moreover, the 50% Fib retracement level of the last crucial drop from the $239 high to $170 low is near the $205 level. Therefore, an upside break above the $202 and $205 levels is needed for bullish continuation. The next important resistance is near the $215 level plus the 61.8% Fib retracement level of the last crucial drop from the $239 high to $170 low.
On the downside, an immediate support is near the $195 level and the 55 simple moving average (4-hours). If the price fails to stay above the 55 SMA, it could correct lower towards the $190 support level. Any further losses below $190 could put a lot of pressure on the bulls.
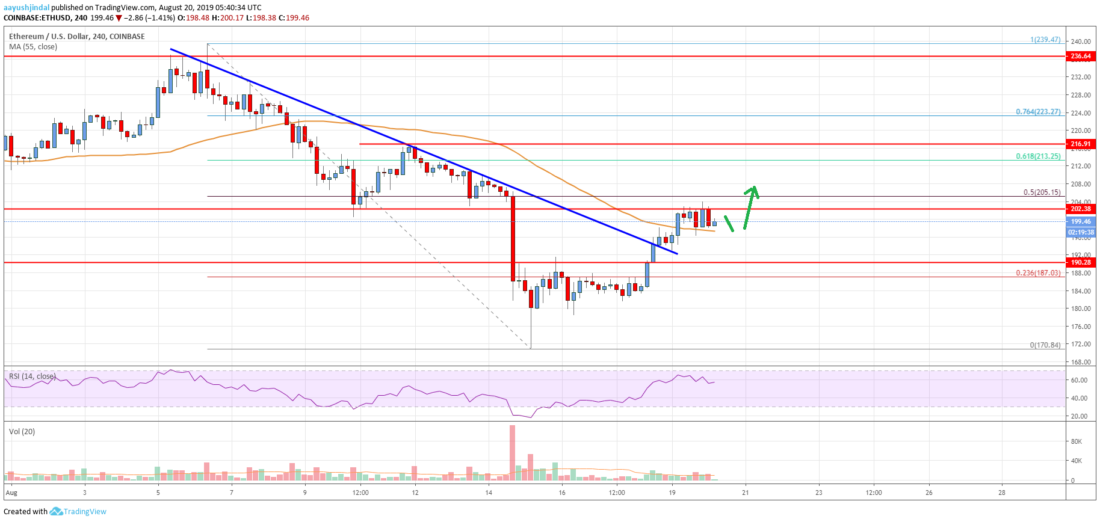
Looking at the chart, Ethereum price is clearly trading with a positive bias above the $195 and $190 levels. Having said that, a proper break above the $205 resistance level is needed for additional gains in the coming sessions. In the mentioned case, the price might test $215 or even $220.
Technical indicators
4 hours MACD - The MACD for ETH/USD is losing momentum in the bullish zone.
4 hours RSI (Relative Strength Index) - The RSI for ETH/USD is currently well above 50, with a flat structure.
Key Support Levels - $195, followed by the $190 zone.
Key Resistance Levels - $205 and $215.
The post Ethereum Price Analysis: ETH Signaling Additional Strength Above $200 appeared first on Live Bitcoin News.

Cryptocurrency is a digital currency that uses encryption (cryptography) to regulate the generation of currency and verify the transfer of funds, independently of a central bank. Cryptography is the practice and study of techniques for secure communication in the presence of third party adversaries.
Blockchain 101 · Crytpo Currency Market
---------------------------------------------------
Trezor: Hardware Wallet
Binance: Exchange for Traders
Ledger Nano S: Hardware Wallet
Coinbase: Exchange for Investors
CoinSwitch: Wallet-to-Wallet Exchange