
- ADA price topped near the $0.0500 level and declined sharply below $0.0450 against the US Dollar.
- The price is down more than 20% from the last swing high and it is currently near $0.0385.
- There was a break below a contracting triangle with support near $0.0478 on the 4-hours chart (data feed via Kraken).
- The price is currently consolidating losses and likely to face resistance near $0.0400 and $0.0425.
Cardano price declined heavily in the past few sessions against the US Dollar and bitcoin. ADA price remains at a risk of more downsides below the $0.0350 level.
Cardano Price Analysis
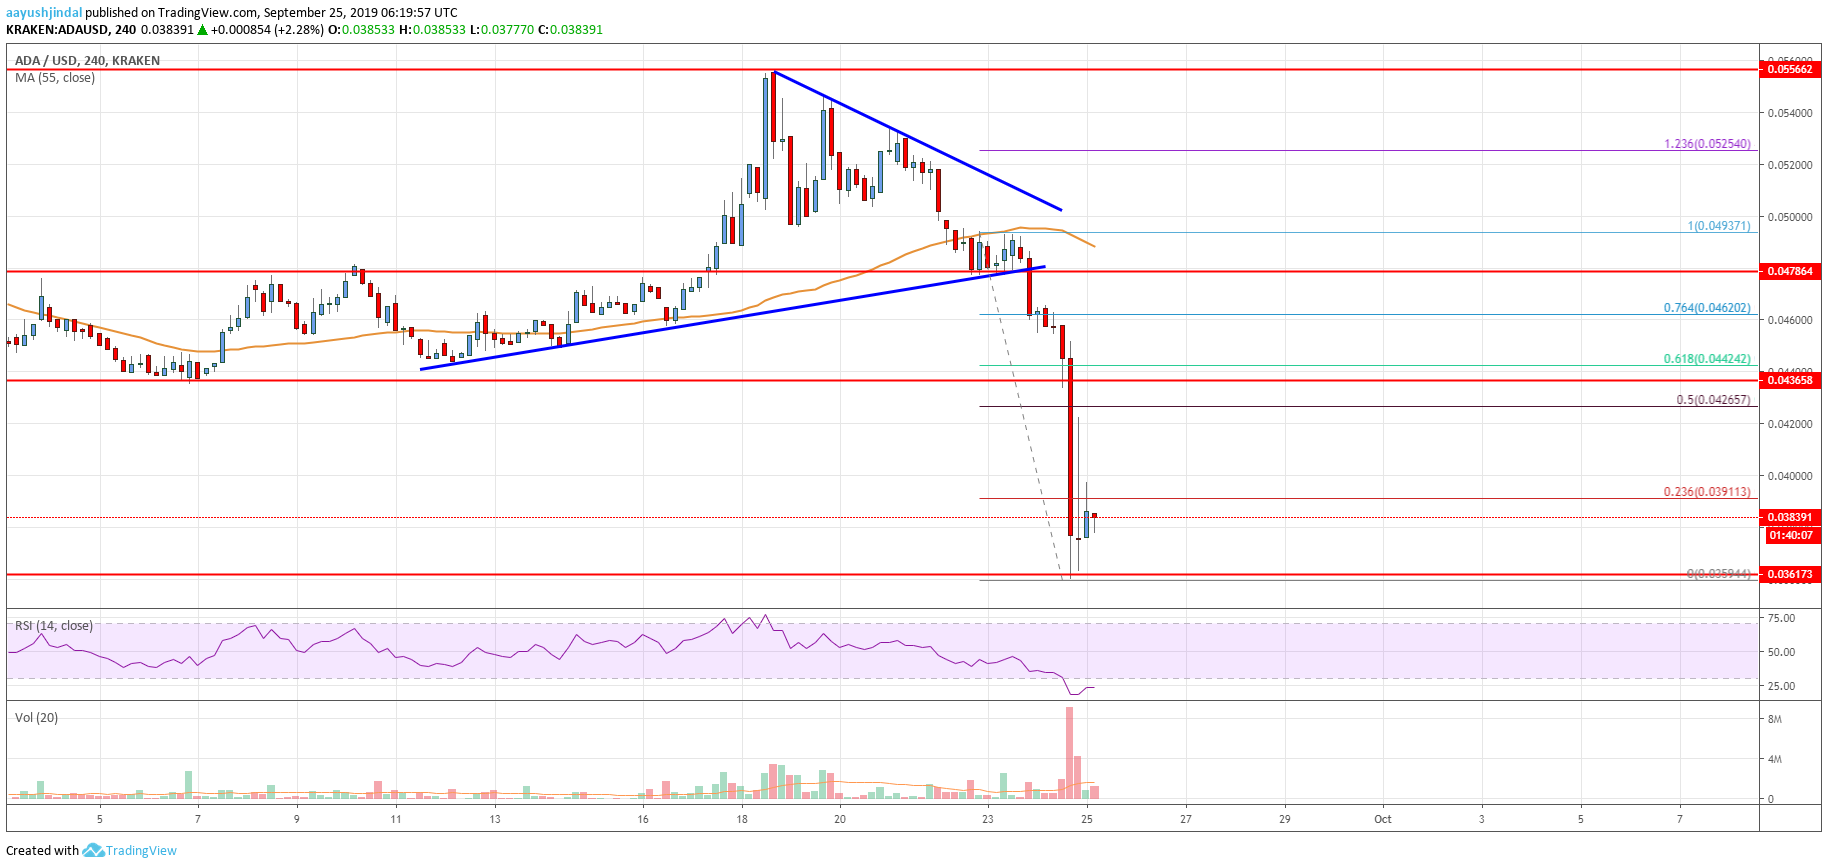
After struggling to clear the $0.0550 resistance, cardano price started trading in a range against the US Dollar. The ADA/USD pair struggled to gain bullish momentum above $0.0500 and recently started a sharp decline. There was a break below the $0.0450 support level to enter a bearish zone. Moreover, there was a close below the $0.0450 level and the 55 simple moving average (4-hours).
More importantly, there was a break below a contracting triangle with support near $0.0478 on the 4-hours chart. The pair broke the $0.0400 support area and traded to a new monthly low at $0.0359. It is currently correcting higher above $0.0380. The price tested the 23.6% Fibonacci retracement level of the recent decline from the $0.0493 swing high to $0.0359 low.
On the upside, there are many resistances near the $0.0400 and $0.0425 levels. Moreover, the 50% Fibonacci retracement level of the recent decline from the $0.0493 swing high to $0.0359 low is near the $0.0425 level to act as a strong resistance. The main resistance is near the $0.0435 and $0.0450 levels (the previous support). Therefore, an upside correction towards $0.0450 is likely to face a strong selling interest.
On the downside, an immediate support is near the $0.0365 and $0.0350 levels. If the price fails to stay above $0.0350, there could be another drop. The next support is near $0.0325, followed by $0.0315. Any further losses could push the price back towards the $0.0300 level.
The chart indicates that ADA price is trading in a bearish zone below $0.0400 and $0.0425. In the short term, there could an upside correction, but the price is likely to face resistance near $0.0400 or $0.0425. As long as the price is trading below the $0.0450 level, there are chances of more losses in the near term.
Technical Indicators
4 hours MACD - The MACD for ADA/USD is currently gaining momentum in the bearish zone.
4 hours RSI - The RSI for ADA/USD is currently correcting higher from the oversold readings.
Key Support Levels - $0.0365 and $0.0350.
Key Resistance Levels - $0.0400 and $0.0425.
The post Cardano (ADA) Price Analysis: Breakdown Looks Real, More Losses Likely appeared first on Live Bitcoin News.

Cryptocurrency is a digital currency that uses encryption (cryptography) to regulate the generation of currency and verify the transfer of funds, independently of a central bank. Cryptography is the practice and study of techniques for secure communication in the presence of third party adversaries.
Blockchain 101 · Crytpo Currency Market
---------------------------------------------------
Trezor: Hardware Wallet
Binance: Exchange for Traders
Ledger Nano S: Hardware Wallet
Coinbase: Exchange for Investors
CoinSwitch: Wallet-to-Wallet Exchange