
- Ethereum price started a downside correction after trading as high as $225 against the US Dollar.
- ETH price is currently trading below the $210 support and is testing the $200 handle.
- There is a crucial bullish trend line forming with support near $198 on the 4-hours chart (data feed from Coinbase).
- The price is likely to bounce back as long as there is no daily close below $198 and $193.
Ethereum price is closing in towards major support near $198 against the US Dollar. ETH price could bounce back as long as it is above the $193 support area.
Ethereum Price Analysis
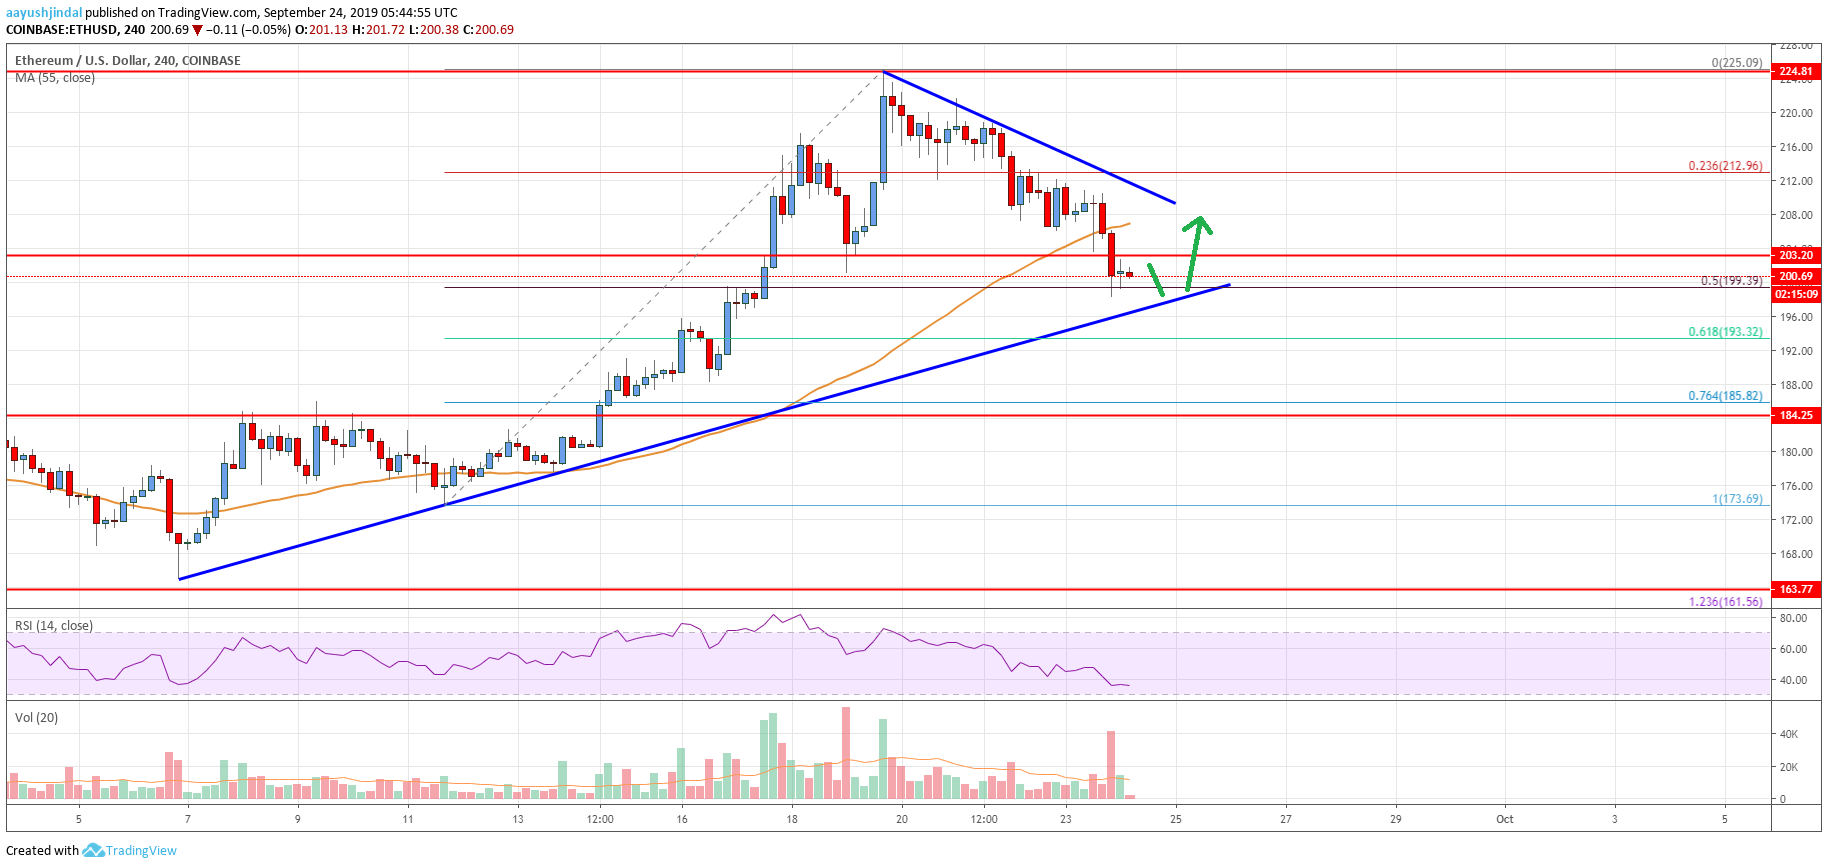
This past week, we saw a solid rise in Ethereum price above the $200 resistance against the US Dollar. The ETH/USD pair even climbed above the $210 resistance and the 55 simple moving average (4-hours). The upward move was such that the price traded to a new multi-week high at $225. However, the price struggled to continue higher and recently started a downside correction below the $215 level.
There was a break below the $210 support area. Moreover, the price traded below the 23.6% Fib retracement level of the last major wave from the $174 swing low to $225 high. It even traded below $205 and the 55 simple moving average (4-hours). At the moment, the price is testing an important support area near $198-$200. Moreover, the 50% Fib retracement level of the last major wave from the $174 swing low to $225 high is near the $200 level.
There is also a crucial bullish trend line forming with support near $198 on the 4-hours chart. The main support is near the $193 level since it coincides with the 61.8% Fib retracement level of the last major wave from the $174 swing low to $225 high. If there is a downside break below the $198 and $193 supports, Ethereum price could move back into a bearish zone.
Conversely, the price may perhaps bounce back from the $198 or $193 support. An immediate resistance is near the $208 level and the 55 simple moving average (4-hours). Additionally, there is a connecting bearish trend line forming with resistance near $210 on the same chart.
Looking at the chart, Ethereum price is closing in towards a major support area near $198 and $193. As long as there is no daily close below $193, the price is likely to bounce back above $210.
Technical indicators
4 hours MACD - The MACD for ETH/USD is gaining momentum in the bearish zone.
4 hours RSI (Relative Strength Index) - The RSI for ETH/USD is currently well below the 40 level.
Key Support Levels - $198, followed by the $193 zone.
Key Resistance Levels - $208 and $210.
The post Ethereum Price Analysis: ETH Testing Key Support, Can It Bounce Back? appeared first on Live Bitcoin News.

Cryptocurrency is a digital currency that uses encryption (cryptography) to regulate the generation of currency and verify the transfer of funds, independently of a central bank. Cryptography is the practice and study of techniques for secure communication in the presence of third party adversaries.
Blockchain 101 · Crytpo Currency Market
---------------------------------------------------
Trezor: Hardware Wallet
Binance: Exchange for Traders
Ledger Nano S: Hardware Wallet
Coinbase: Exchange for Investors
CoinSwitch: Wallet-to-Wallet Exchange