
- Litecoin price recovered recently above the $65.00 resistance area against the US Dollar.
- LTC price is currently facing a strong resistance near the $70.00 and $71.00 levels.
- There is a major bearish trend line forming with resistance near $68.60 on the 4-hours chart of the LTC/USD pair (data feed from Coinbase).
- The pair could start a major decline if it continues to face hurdles near $70.00.
Litecoin price is struggling to gain bullish momentum against the US Dollar and bitcoin. LTC is preparing for the next major break either above $70.00 or below $65.00.
Litecoin Price Analysis
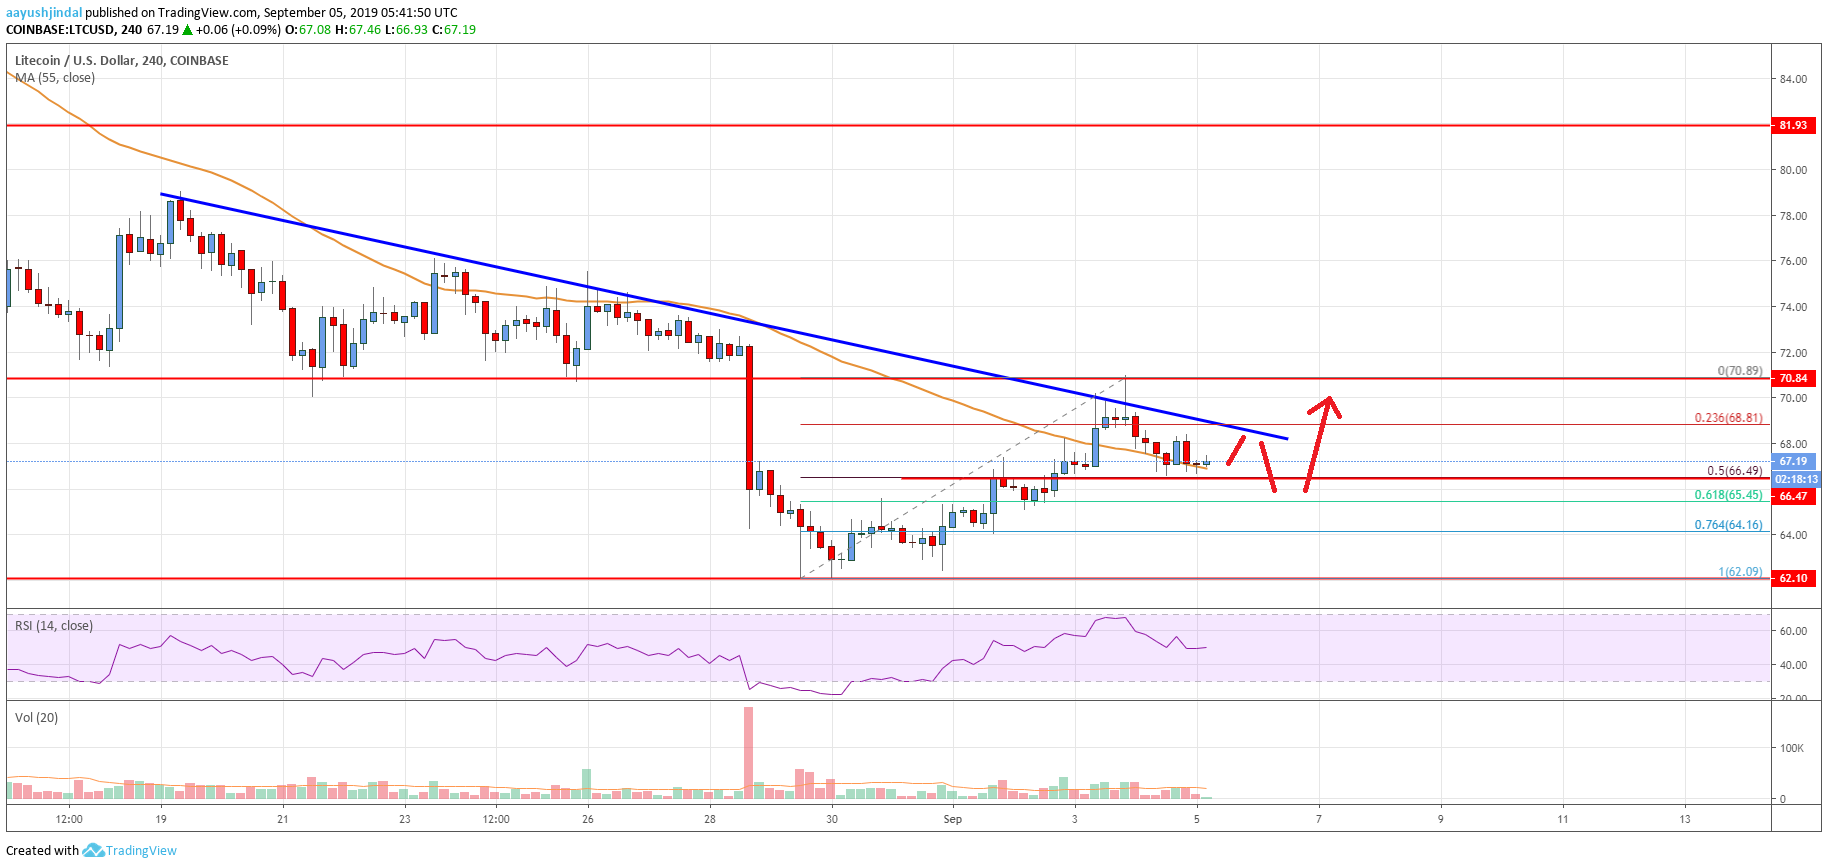
This past week, litecoin price started a decent recovery above the $60.00 level against the US Dollar. The LTC/USD pair even broke the $65.00 resistance level and the 55 simple moving average (4-hours). Finally, there was a break above the $70.00 level, but the bull failed to remain in action. A swing high was formed near $70.89 and recently the price started a downside correction.
It broke the $70.00 level plus the 23.6% Fib retracement level of the last upward move from the $62.09 low to $70.89 high. Moreover, there was a break below the $68.00 level, but the price stayed above the $65.00 support level. At the moment, the price is consolidating near $67.00 and the 55 simple moving average (4-hours). An immediate support is near the $66.50 level since it coincides with the 50% Fib retracement level of the last upward move from the $62.09 low to $70.89 high.
If there is a downside break below $66.50, the price could test the $65.00 support. The 61.8% Fib retracement level of the last upward move from the $62.09 low to $70.89 high is also near the $65.00 level. Therefore, the price is likely to bounce back if it tests the $65.50 or $65.00 support. On the upside, there are many hurdles near the $70.00 and $71.00 levels.
Additionally, there is a major bearish trend line forming with resistance near $68.60 on the 4-hours chart of the LTC/USD pair. If there is an upside break above the trend line and $70.00, the price could attempt to clear the $70.89 swing high.
Looking at the chart, litecoin price is clearly consolidating above the $65.00 and $66.00 support levels. Therefore, it seems to be preparing for the next key break either above $70.00 or below the $65.00 support in the near term.
Technical indicators
4 hours MACD - The MACD for LTC/USD is currently losing momentum in the bullish zone.
4 hours RSI (Relative Strength Index) - The RSI for LTC/USD is currently just below the 50 level.
Key Support Levels - $66.00 and $65.00.
Key Resistance Levels - $68.50 and $70.00.
The post Litecoin (LTC) Price Analysis: Risk of Additional Weakness Below $65 appeared first on Live Bitcoin News.

Cryptocurrency is a digital currency that uses encryption (cryptography) to regulate the generation of currency and verify the transfer of funds, independently of a central bank. Cryptography is the practice and study of techniques for secure communication in the presence of third party adversaries.
Blockchain 101 · Crytpo Currency Market
---------------------------------------------------
Trezor: Hardware Wallet
Binance: Exchange for Traders
Ledger Nano S: Hardware Wallet
Coinbase: Exchange for Investors
CoinSwitch: Wallet-to-Wallet Exchange