
- Tron price is currently correcting higher after trading as low as $0.0151 against the US Dollar.
- TRX price is likely to face a lot of hurdles on the upside near the $0.0163 and $0.0165 levels.
- There is a major bearish trend line forming with resistance near $0.0166 on the 4-hours chart (data feed via Bitfinex).
- The price must surpass the $0.0163 and $0.0165 resistance levels to recover further in the near term.
TRON price is slowly rebounding above $0.0155 against the US Dollar, but struggling vs bitcoin. TRX price is likely to fail near the key $0.0165 resistance area.
Tron Price Analysis
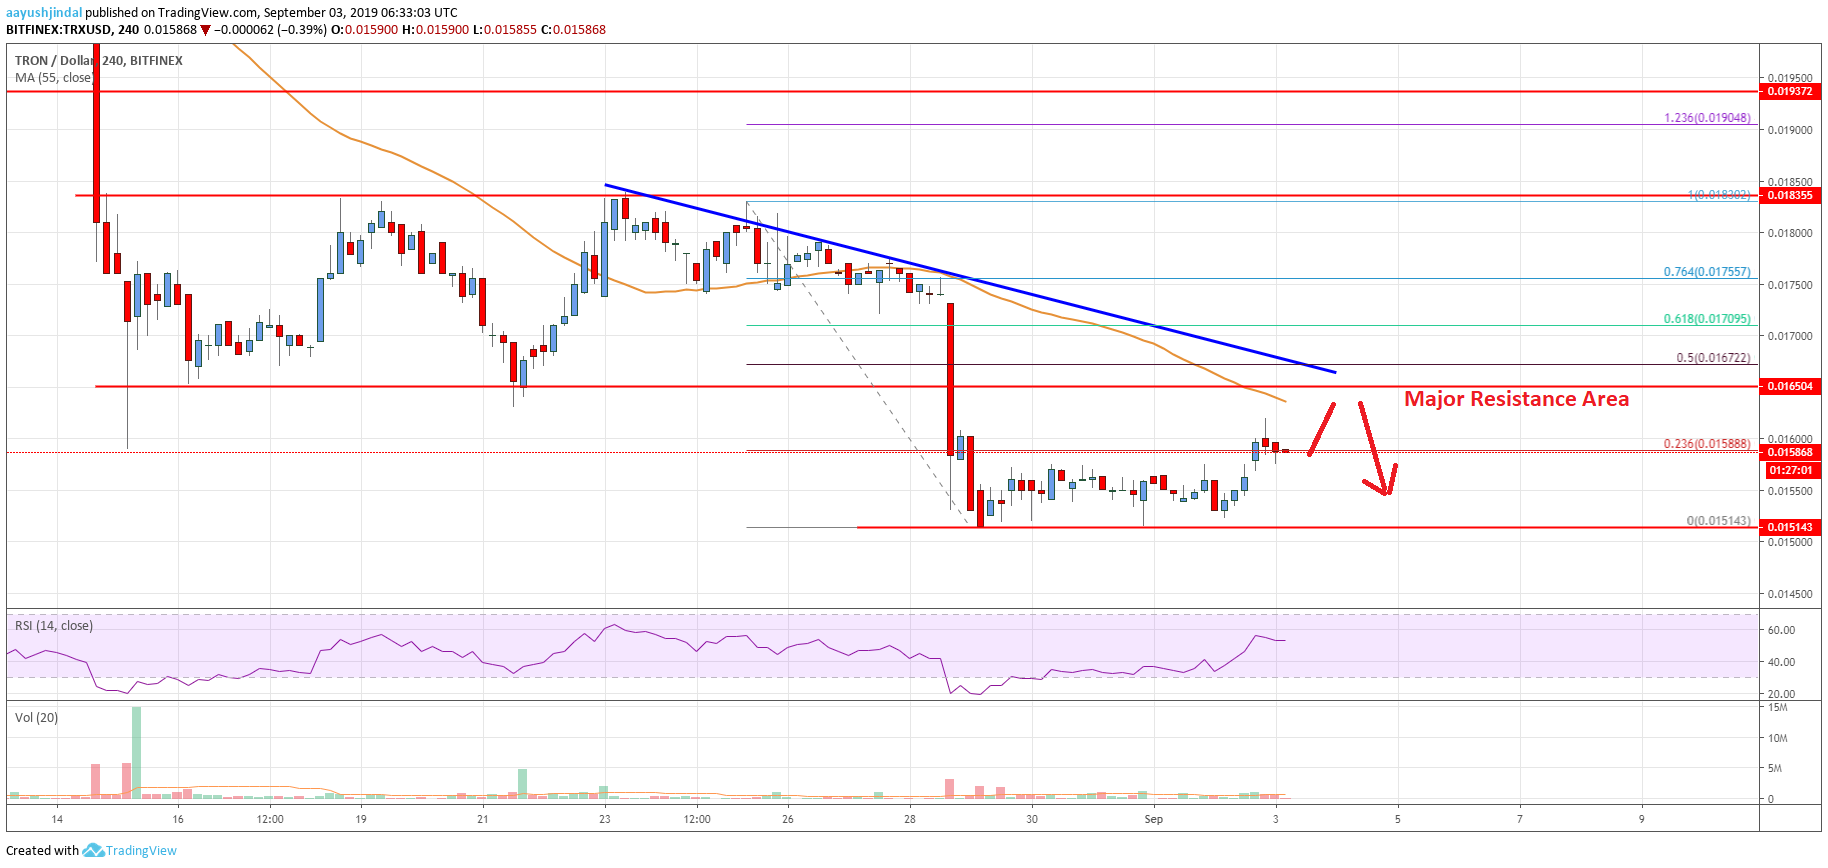
This past week, TRON price failed to correct higher and declined below the $0.0165 support against the US Dollar. The TRX/USD pair even broke the $0.0160 support level and the 55 simple moving average (4-hours). Finally, it declined below $0.0155 and traded to a new monthly low at $0.0151. Recently, the price started an upside correction above the $0.0155 resistance level.
Moreover, the price traded a few points above the 23.6% Fibonacci retracement level of the last decline from the $0.0183 high to $0.0151 low. However, it seems like the price is struggling to gain momentum above the $0.0160 resistance level. The next key resistance is near the $0.0163 level since it coincides with the 55 simple moving average (4-hours). The main resistance on the upside is near the $0.0165 level (the previous support).
There is also a major bearish trend line forming with resistance near $0.0166 on the 4-hours chart. The trend line coincides with the 50% Fibonacci retracement level of the last decline from the $0.0183 high to $0.0151 low. Therefore, tron price is likely to face a strong resistance near the $0.0165 and $0.0166 levels. If there is a successful close above $0.0166, the price could climb towards the $0.0175 resistance.
The 76.4% Fibonacci retracement level of the last decline from the $0.0183 high to $0.0151 low is near the $0.0175 level to prevent gains. The next important resistance is near the $0.0183 level. Conversely, if the price fails to climb above the $0.0165 or $0.0166 resistance, it could start a fresh decline.
The chart indicates that TRX price is clearly facing many hurdles near $0.0165. As long as the price is trading below $0.0165, there is a risk of more downsides. An immediate support is at $0.0155, below which the price could struggle to hold the $0.0150 support.
Technical Indicators
4 hours MACD - The MACD for TRX/USD is slowly gaining momentum in the bullish zone.
4 hours RSI - The RSI for TRX/USD is currently placed nicely above the 50 level.
Key Support Levels - $0.0155 and $0.0150.
Key Resistance Levels - $0.0163, $0.0165 and $0.0175.
The post Tron (TRX) Price Analysis: Bulls Facing Uphill Task Near $0.0165 appeared first on Live Bitcoin News.

Cryptocurrency is a digital currency that uses encryption (cryptography) to regulate the generation of currency and verify the transfer of funds, independently of a central bank. Cryptography is the practice and study of techniques for secure communication in the presence of third party adversaries.
Blockchain 101 · Crytpo Currency Market
---------------------------------------------------
Trezor: Hardware Wallet
Binance: Exchange for Traders
Ledger Nano S: Hardware Wallet
Coinbase: Exchange for Investors
CoinSwitch: Wallet-to-Wallet Exchange