
- Bitcoin cash price is facing a strong resistance near the $240 level against the US Dollar.
- The price is currently declining, but it might find support near the $220 level.
- There is a major ascending channel forming with support near $220 on the 4-hours chart of the BCH/USD pair (data feed from Kraken).
- The pair must break the key $240 resistance area to continue higher in the near term.
Bitcoin cash price is struggling to gain bullish momentum above $240 against the US Dollar. If BCH/USD breaks the $220 support, it could accelerate its decline.
Bitcoin Cash Price Analysis
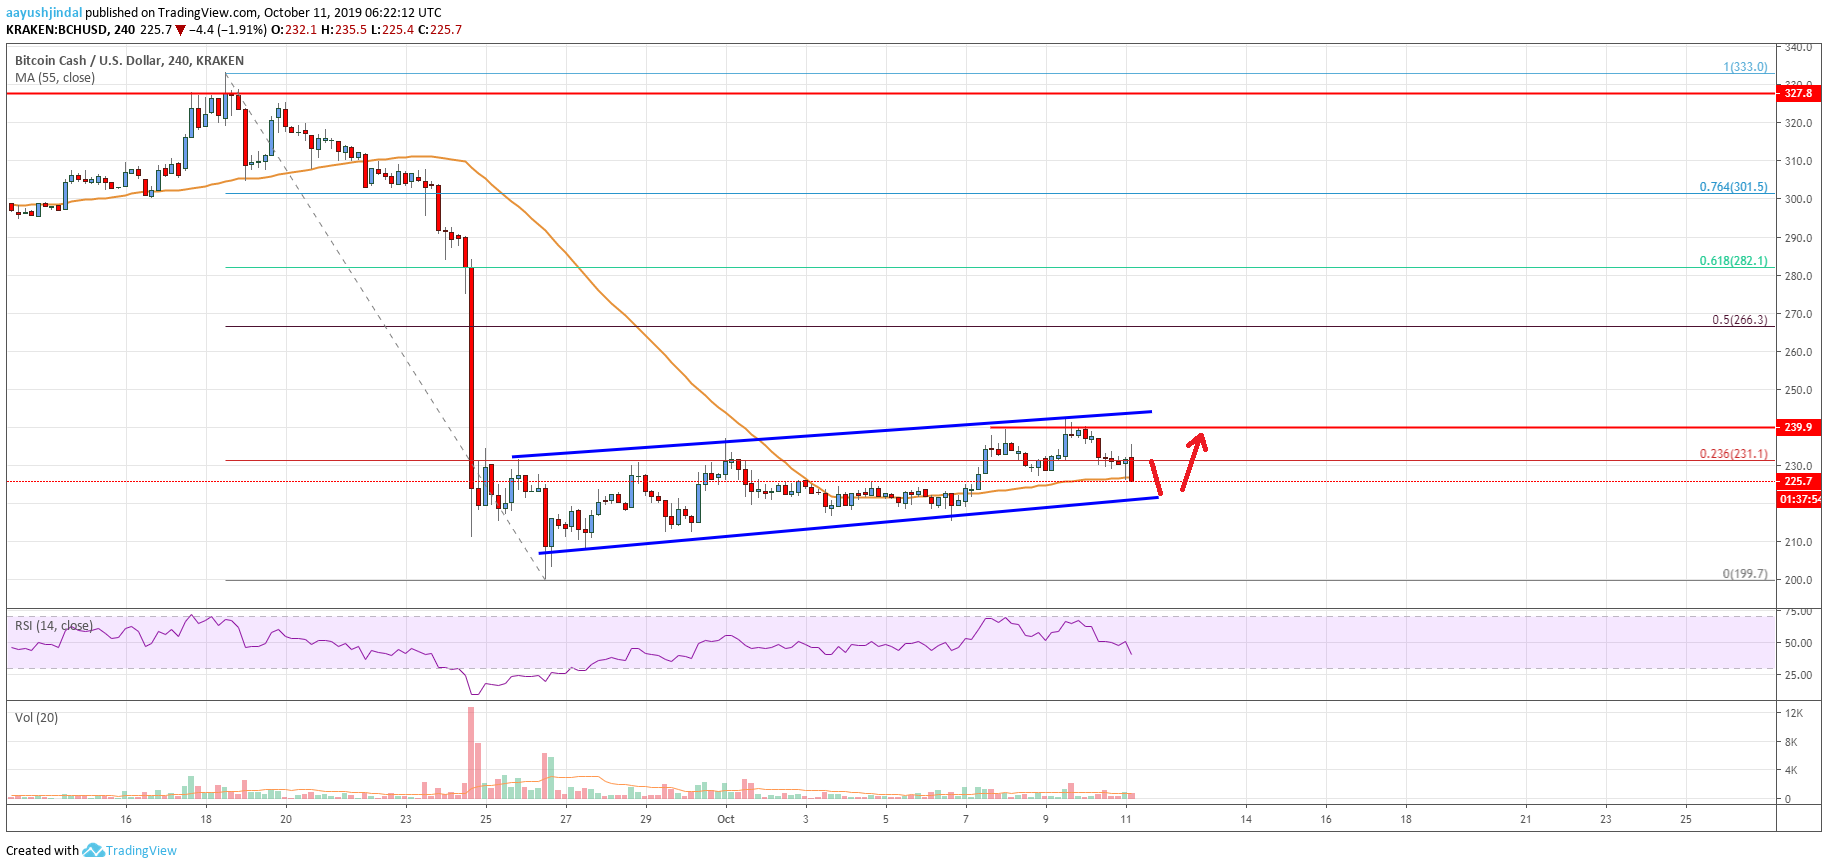
In the past few days, bitcoin cash price mostly traded in a range above the $210 support against the US Dollar. The BCH/USD pair started a slow and steady increase above the $220 resistance level. Moreover, there was a close above the $220 level and the 55 simple moving average (4-hours). It opened the doors for more gains above the $230 resistance level.
Moreover, there was a break above the 23.6% Fib retracement level of the crucial drop from the $333 high to $199 low. However, the price struggled to clear the $240 resistance area. At the moment, it seems like there is a major ascending channel forming with support near $220 on the 4-hours chart of the BCH/USD pair. The pair is currently declining and is trading near the $225 level.
An immediate support is near the $220 level. If there is a downside break below the $220 support, the price could decline further towards the $210 support. Any further losses might put bitcoin cash at a risk of a downside break below the main $200 support level in the near term.
On the upside, the main resistance is near the $240 level. If there is an upside break above $240, the price could test the $250 resistance area. The next key resistance is near the $265 level. Moreover, the 50% Fib retracement level of the crucial drop from the $333 high to $199 low is near the $266 level. Therefore, a clear break above $240 might call for a move towards the $265 level.
Looking at the chart, bitcoin cash price is clearly facing a strong resistance near the $240 level. If it continues to struggle below the $240 level, there is a risk of more downsides below the $220 and $210 levels in the near term.
Technical indicators
4 hours MACD - The MACD for BCH/USD is currently gaining momentum in the bearish zone.
4 hours RSI (Relative Strength Index) - The RSI for BCH/USD is now well below the 50 level.
Key Support Levels - $220 and $210.
Key Resistance Levels - $240 and $250.
The post Bitcoin Cash Analysis: BCH Remains At Risk Of Extended Decline appeared first on Live Bitcoin News.

Cryptocurrency is a digital currency that uses encryption (cryptography) to regulate the generation of currency and verify the transfer of funds, independently of a central bank. Cryptography is the practice and study of techniques for secure communication in the presence of third party adversaries.
Blockchain 101 · Crytpo Currency Market
---------------------------------------------------
Trezor: Hardware Wallet
Binance: Exchange for Traders
Ledger Nano S: Hardware Wallet
Coinbase: Exchange for Investors
CoinSwitch: Wallet-to-Wallet Exchange