
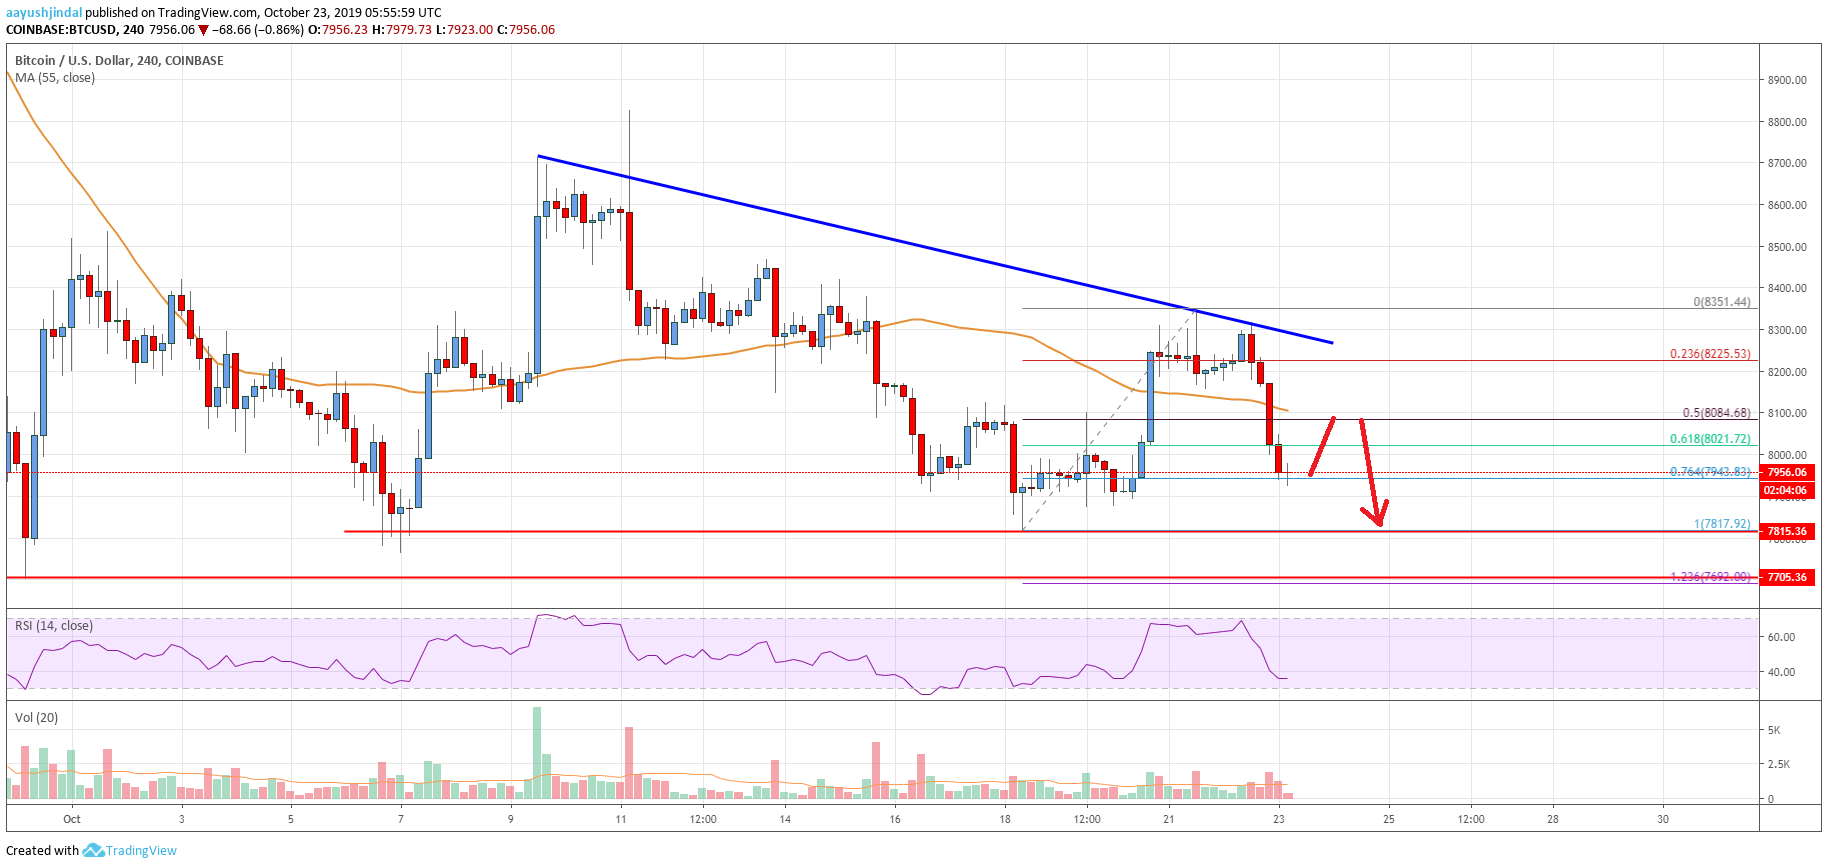
- Bitcoin price failed to surpass $8,350 and $8,400 resistance levels against the US Dollar.
- The price is currently declining and it is trading below the $8,080 and $8,000 support levels.
- There is a major bearish trend line forming with resistance near $8,280 on the 4-hours chart of the BTC/USD pair (data feed from Coinbase).
- The pair is likely to continue lower and it might revisit the $7,800 and $7,700 support levels.
Bitcoin price is trading with a bearish bias below $8,350 against the US Dollar. BTC remains at a risk of more downsides if it fails to hold the $7,700 support.
Bitcoin Price Analysis
This past week, bitcoin price started a fresh recovery from the $7,800 support area against the US Dollar. BTC gained momentum above the $8,000 and $8,100 resistance levels. Moreover, there was a break above $8,280 and the 55 simple moving average (4-hours).
Finally, the price spiked above the $8,300 resistance, but it failed to retain bullish momentum. A swing high was formed near $8,350 and recently the price started a fresh decline.
It broke a couple of important supports near the $8,200 and $8,100. Bitcoin even declined below the 50% Fib retracement level of the upward move from the $7,817 low to $8,351 high.
More importantly, there was a close below $8,080 and the 55 simple moving average (4-hours). The price is now trading below $8,000 and is testing the 76.4% Fib retracement level of the upward move from the $7,817 low to $8,351 high.
If there is a downside break below $7,940, the price could revisit the $7,800 support area. Any further declines might push the price towards the main $7,700 support area. It coincides with the 1.236 Fib extension level of the upward move from the $7,817 low to $8,351 high.
Below $7,700, the price could decline heavily towards the $7,500 and $7,400 levels. On the upside, an initial resistance is near the $8,100 level and the 55 simple moving average (4-hours). In addition, there is a major bearish trend line forming with resistance near $8,280 on the 4-hours chart of the BTC/USD pair.
Bitcoin Price
Looking at the chart, bitcoin price is currently trading with a bearish bias below $8,080 and $8,200. Therefore, there are chances of more losses towards $7,800 and $7,700. Having said that, the price must stay above $7,700 to start a fresh recovery. If not, it could tumble towards $7,500 or even $7,200.
Technical indicators
4 hour MACD - The MACD is gaining momentum in the bearish zone.
4 hour RSI (Relative Strength Index) - The RSI is currently well below the 40 level, with a bearish angle.
Key Support Levels - $7,800 and $7,700.
Key Resistance Levels - $8,080, $8,220 and $8,300.
The post Bitcoin Price Analysis: BTC Could Tumble Below $7,700 appeared first on Live Bitcoin News.

Cryptocurrency is a digital currency that uses encryption (cryptography) to regulate the generation of currency and verify the transfer of funds, independently of a central bank. Cryptography is the practice and study of techniques for secure communication in the presence of third party adversaries.
Blockchain 101 · Crytpo Currency Market
---------------------------------------------------
Trezor: Hardware Wallet
Binance: Exchange for Traders
Ledger Nano S: Hardware Wallet
Coinbase: Exchange for Investors
CoinSwitch: Wallet-to-Wallet Exchange