
- Stellar lumen price is gaining bullish momentum and is trading nicely above $0.0650 against the US Dollar.
- XLM price is likely to rise further above the $0.0700 resistance in the near term.
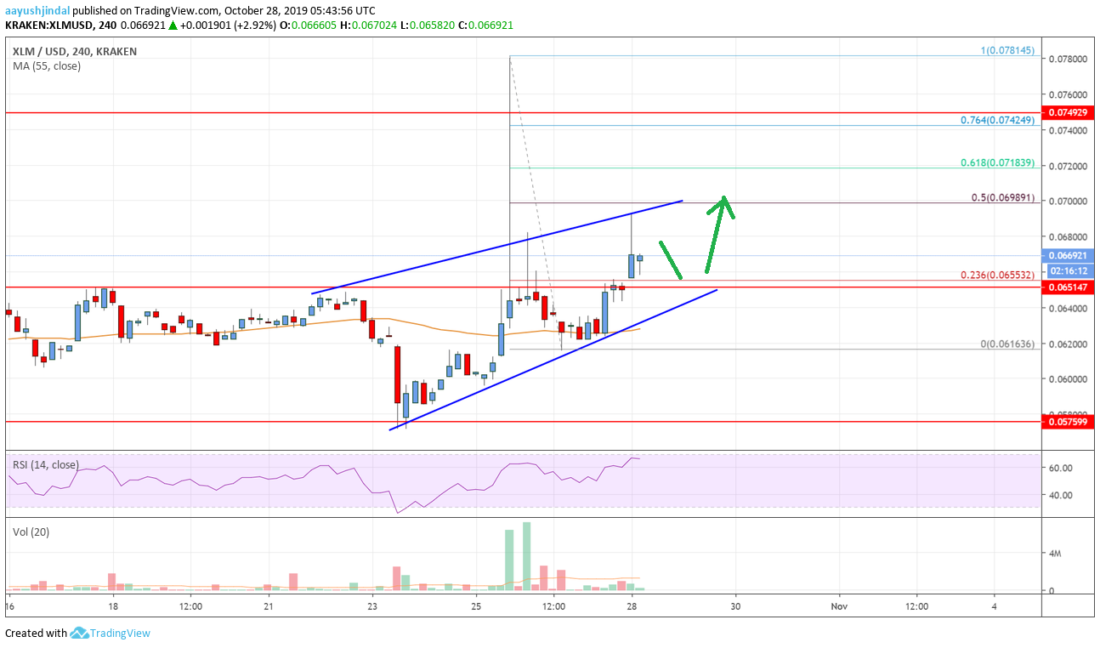
- There is a major bullish trend line forming with support near $0.0655 on the 4-hours chart (data feed via Kraken).
- The pair remains well supported on the downside unless there is a close below the $0.0620 support.
Stellar lumen price is trading in an uptrend against the US Dollar and bitcoin. XLM price continue to rise and it could even revisit the $0.0750 resistance area.
Stellar Lumen Price Analysis (XLM to USD)
After forming a strong support base near $0.0575, stellar lumen price started a decent upward move against the US Dollar. The XLM/USD pair climbed above the key $0.0600 and $0.0620 resistance levels to move into a positive zone.
Moreover, there was a sharp rally above the $0.0650 resistance and the 55 simple moving average (4-hours). Finally, the price spiked above the $0.0700 resistance and traded to a new monthly high at $0.0781 on Kraken.
Later, there was a major downside correction below the $0.0700 level. The price even traded below the $0.0650 support area. However, the $0.0620 area acted as a strong support along with the 55 simple moving average (4-hours).
A low was formed near $0.0616 and the price is currently moving higher. It broke the key $0.0650 resistance area. Besides, there was a break above the 23.6% Fibonacci retracement level of the recent decline from the $0.0781 high to $0.0616 low.
On the upside, the $0.0695 and $0.0700 levels are important hurdles for stellar price. Additionally, the 50% Fibonacci retracement level of the recent decline from the $0.0781 high to $0.0616 low is also near the $0.0698 level.
Therefore, a clear break above the $0.0700 resistance might set the pace for more upsides. The next major resistance for the bulls is near the $0.0750 area. An intermediate resistance is near the 76.4% Fibonacci retracement level of the recent decline from the $0.0781 high to $0.0616 low.
On the downside, there is a strong support forming near $0.0650. More importantly, there is a major bullish trend line forming with support near $0.0655 on the 4-hours chart.
Stellar Lumen Price
The chart indicates that XLM price is showing a lot of positive signs above the $0.0650 support. Therefore, there are high chances of another upward move above the $0.0700 resistance.
Technical Indicators
4 hours MACD - The MACD for XLM/USD is slowly gaining pace in the bullish zone.
4 hours RSI - The RSI for XLM/USD is currently well above the 55 level.
Key Support Levels - $0.0650 and $0.0620.
Key Resistance Levels - $0.0695, $0.0700 and $0.0750.
The post Stellar Lumen (XLM) Price Likely Setting Up For Next Rally appeared first on Live Bitcoin News.

Cryptocurrency is a digital currency that uses encryption (cryptography) to regulate the generation of currency and verify the transfer of funds, independently of a central bank. Cryptography is the practice and study of techniques for secure communication in the presence of third party adversaries.
Blockchain 101 · Crytpo Currency Market
---------------------------------------------------
Trezor: Hardware Wallet
Binance: Exchange for Traders
Ledger Nano S: Hardware Wallet
Coinbase: Exchange for Investors
CoinSwitch: Wallet-to-Wallet Exchange