
- Tron price is declining and trading below the key $0.0184 support area against the US Dollar.
- TRX price is under a lot of pressure below the $0.0175 pivot level.
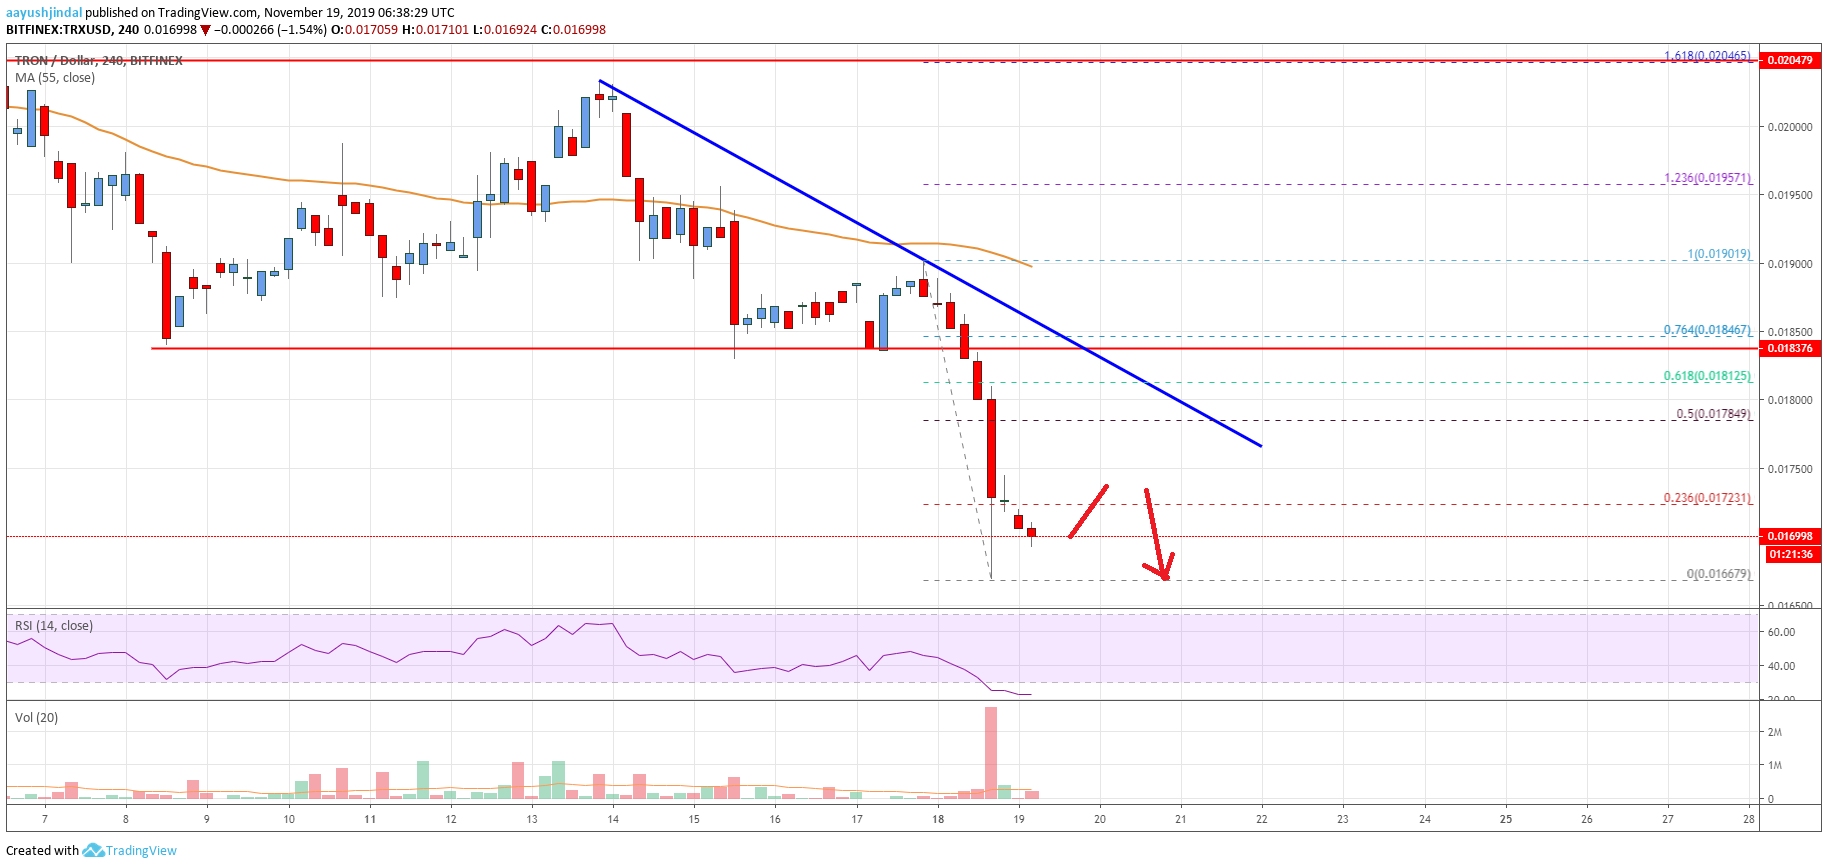
- There is a key bearish trend line forming with resistance near $0.0181 on the 4-hours chart (data feed via Bitfinex).
- The price remains at a risk of more downsides towards the main $0.0150 support area.
TRON price started a fresh decline against the US Dollar and bitcoin. TRX price is now trading well below $0.0184 and it could continue to slide towards $0.0150 in the near term.
Tron Price Analysis
This past week, there were mostly bullish moves in TRON price above the $0.0184 and $0.0190 levels against the US Dollar. Moreover, TRX price climbed above the $0.0200 resistance and settled above the 55 simple moving average (4-hours).
However, the upward move was capped by the $0.0205 resistance area. The price failed to stay above the $0.0200 level and recently started a fresh decline. Besides, bitcoin, Ethereum and ripple declined heavily in the past few days, sparking bearish moves in tron.
TRX price broke the main $0.0184 support area to enter a bearish zone. Additionally, there was a close below the $0.0175 pivot level and the 55 simple moving average (4-hours).
The recent low was near $0.0166 and the price is currently trading with a bearish angle. An immediate resistance is near the $0.0172 level. It represents the 23.6% Fibonacci retracement level of the recent decline from the $0.0190 high to $0.0166 low.
If the price climbs above $0.0172, it could trade above $0.0175. The next key resistance is near the $0.0175 level. More importantly, there is a key bearish trend line forming with resistance near $0.0181 on the 4-hours chart.
The 50% Fibonacci retracement level of the recent decline from the $0.0190 high to $0.0166 low might also stop the bulls near the $0.0178 level. The main resistance area is near the previous breakdown level at $0.0184.
If the price continues to move down, an initial support is near the $0.0165 level. However, the major support is near the $0.0150 level, where the bulls are likely to take a stand.
Tron Price
The chart indicates that TRX price is gaining bearish momentum below the $0.0175 level. Therefore, there is a risk of more losses below the $0.0165 level. On the upside, a clear break above $0.0184 is needed for a fresh increase to $0.0200.
Technical Indicators
4 hours MACD - The MACD for TRX/USD is currently gaining momentum in the bearish zone.
4 hours RSI - The RSI for TRX/USD is currently declining and it is near the oversold levels.
Key Support Levels - $0.0165 and $0.0150.
Key Resistance Levels - $0.0175, $0.0178 and $0.0184.
The post Tron (TRX) Price Analysis: Back In Downtrend, $0.0150 Holds Key appeared first on Live Bitcoin News.