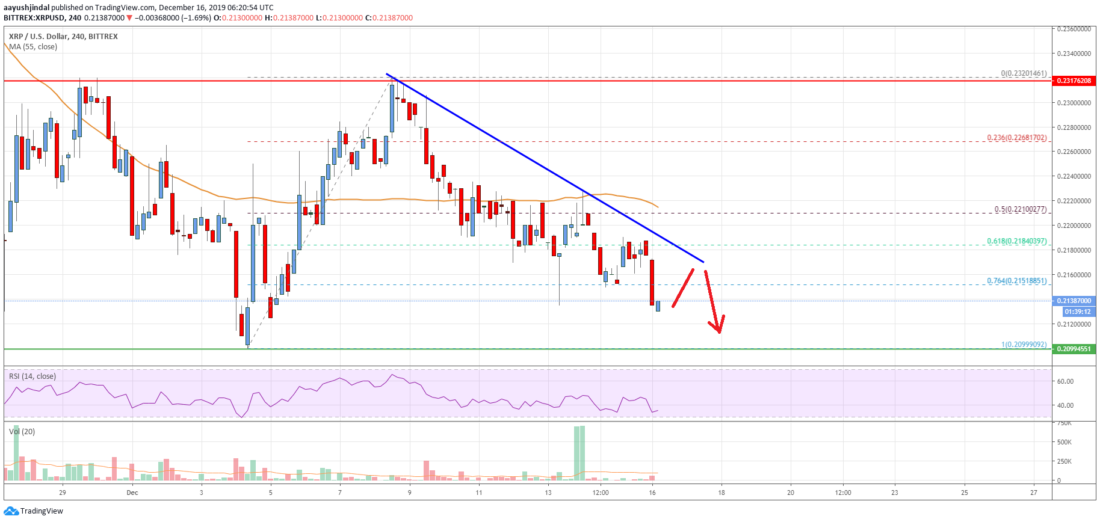
- Ripple price is declining and it is trading below the $0.2200 pivot area against the US dollar.
- The price is likely to continue lower towards the $0.2100 and $0.2050 support levels.
- There is a key bearish trend line forming with resistance near $0.2180 on the 4-hours chart of the XRP/USD pair (data source from Bittrex).
- A downside break below the $0.2100 support area could accelerate decline towards $0.2020.
Ripple price is facing an increase in selling pressure below $0.2200 against the US Dollar. XRP price is likely to continue lower towards $0.2100 or even $0.2020.
Ripple Price Analysis
In the past few days, ripple price made two attempts to surpass the $0.2320 resistance against the US Dollar. However, XRP/USD failed to continue above $0.2320 and started a steady decline.
It broke the $0.2266 support area to enter a bearish zone. Moreover, there was a close below the $0.2200 level and the 55 simple moving average (4-hours). It opened the doors for more losses below the $0.2180 level.
Besides, the price settled below the 61.8% Fib retracement level of the upward move from the $0.2099 low to $0.2320 high. The price is now trading well below the $0.2180 level and the 55 simple moving average (4-hours).
An immediate support is near the $0.2100 level. It seems like the price is likely to trade below the $0.2100 level considering the fact that it is now trading below the 76.4% Fib retracement level of the upward move from the $0.2099 low to $0.2320 high.
The next major support is near the $0.2045 level. It is close to the 1.236 Fib extension level of the upward move from the $0.2099 low to $0.2320 high.
Any further losses may perhaps lead ripple price towards the $0.2020 support area. The next major support is near the $0.2000 area.
On the upside, there are many hurdles for the bulls near the $0.2180 and $0.2200 levels. Additionally, there is a key bearish trend line forming with resistance near $0.2180 on the 4-hours chart of the XRP/USD pair.
Therefore, if the price breaks the trend line resistance, it could test the $0.2220 zone and the 55 SMA. A close above the $0.2220 barrier is needed for a fresh increase towards the $0.2320 resistance.
Looking at the chart, ripple price is at a risk of a downside break below $0.2120 and $0.2100. The main target for the bears could be $0.2040 or $0.2020.
Technical indicators
4 hours MACD - The MACD for XRP/USD is losing momentum in the bearish zone.
4 hours RSI (Relative Strength Index) - The RSI for XRP/USD is currently correcting higher towards the 40 level.
Key Support Levels - $0.2120, $0.2100 and $0.2045.
Key Resistance Levels - $0.2180 and $0.2220.
The post Ripple Price Analysis: XRP Trend Overwhelmingly Negative appeared first on Live Bitcoin News.


